The main window of the Analytics Dashboard provides high level information about identified, color-coded Faults and/or Systems.
Analytics Dashboard and Content Viewer Roles
The Analytics Dashboard and Content Viewer are separate plugins that work in conjunction to provide both high level and specific information about identified Faults/statuses.
Dashboard - displays broad categories determined by the types of information contained in the associated Content Viewer(s)
Can support multiple Content Viewers
When multiple Viewers are available, the Dashboard selection dictates which Content Viewer displays on the right-hand side of the screen
Viewer - displays detailed information relevant to a selected item on the Dashboard
Dashboard Views
The default Dashboard displays Fault categories

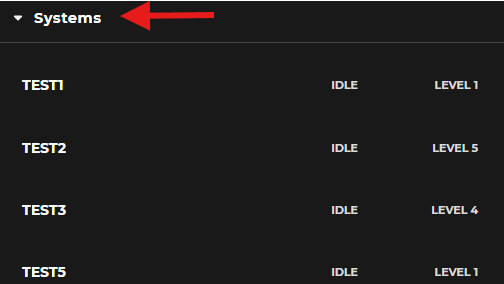
When Systems is an available option in your Faults dropdown menu, you may elect to view System categories in the Dashboard window
Displays System names and initial System information
Dashboard Scroll Bar
Appears just below the Filter icon whenever the Dashboard displays a list of items that exceeds the size of its window

Dashboard Column Layout
Think of the columns in the main Dashboard window as broad, dynamic categories relevant to the specific information contained in the associated Content Viewer(s).
Columns may contain information related to:
Faults
Systems
Components
Time stamps
Etc.
NOTE
When you select an item on the Dashboard, your selection automatically includes all columns displayed in that horizontal row.
The columns on your Dashboard may look different from the examples in this article.

Column Examples
State of the Fault
Displays Fault status information in color-coded boxes called pills

In the example image above:
Red = Critical Faults
Yellow = Fault Warning
Blue = Faults with Informative messages relevant to fault prediction
Green = Successfully (Positive) mitigated Faults
Fault Name or Code
Displays Fault identification information
Full word example: Unbalanced Platform
Code example: GEN2 (for Generator 2)
Affected System
Displays the name or abbreviation of the System impacted by a specific fault
Example: Firefighting System or FFS
NOTE
The Dashboard only displays System relevant data if the Content Viewer supplies a Systems list.
Time Stamp
Displays the date and time a specific Fault occurred
