- 12 Sep 2024
- 1 Minute to read
- DarkLight
- PDF
Getting Started: Data Exchange Tool
- Updated on 12 Sep 2024
- 1 Minute to read
- DarkLight
- PDF
The SLD45 Data Exchange (DataEx) Tool is a data ecosystem built around an interactive map of Cape Canaveral. This tool maneuvers seamlessly between the default SLD Map Viewer plugin and the SLD Events plugin. Users control how they view Events (e.g., Transports, Launches) via an interactive Timeline feature.
Use Case
The launch cadence at Cape Canaveral has increased exponentially, and each launch requires a great deal of coordination. Transporting rocket bodies and boosters from the hangar to the launch pad can take hours—often snarling traffic and making it difficult to enter or leave the base.
The DataEx Tool gives SLD45 personnel the ability to pull from multiple authoritative data sources to visualize and present an accurate picture of the Cape at a selected date and/or time, leveraging Beast Core’s strength of data aggregation to:
See what’s happening
Plan accordingly
Deconflict issues that arise
DataEx Tool Layout and Navigation
When the application launches, click the blue Accept button on the license agreement to proceed.
Default Settings

The tool opens in the SLD Map Viewer plugin
The Timeline opens in the Live view (current date and time)

The map displays an accurate representation of Cape Canaveral in the horizontal view (facing East)
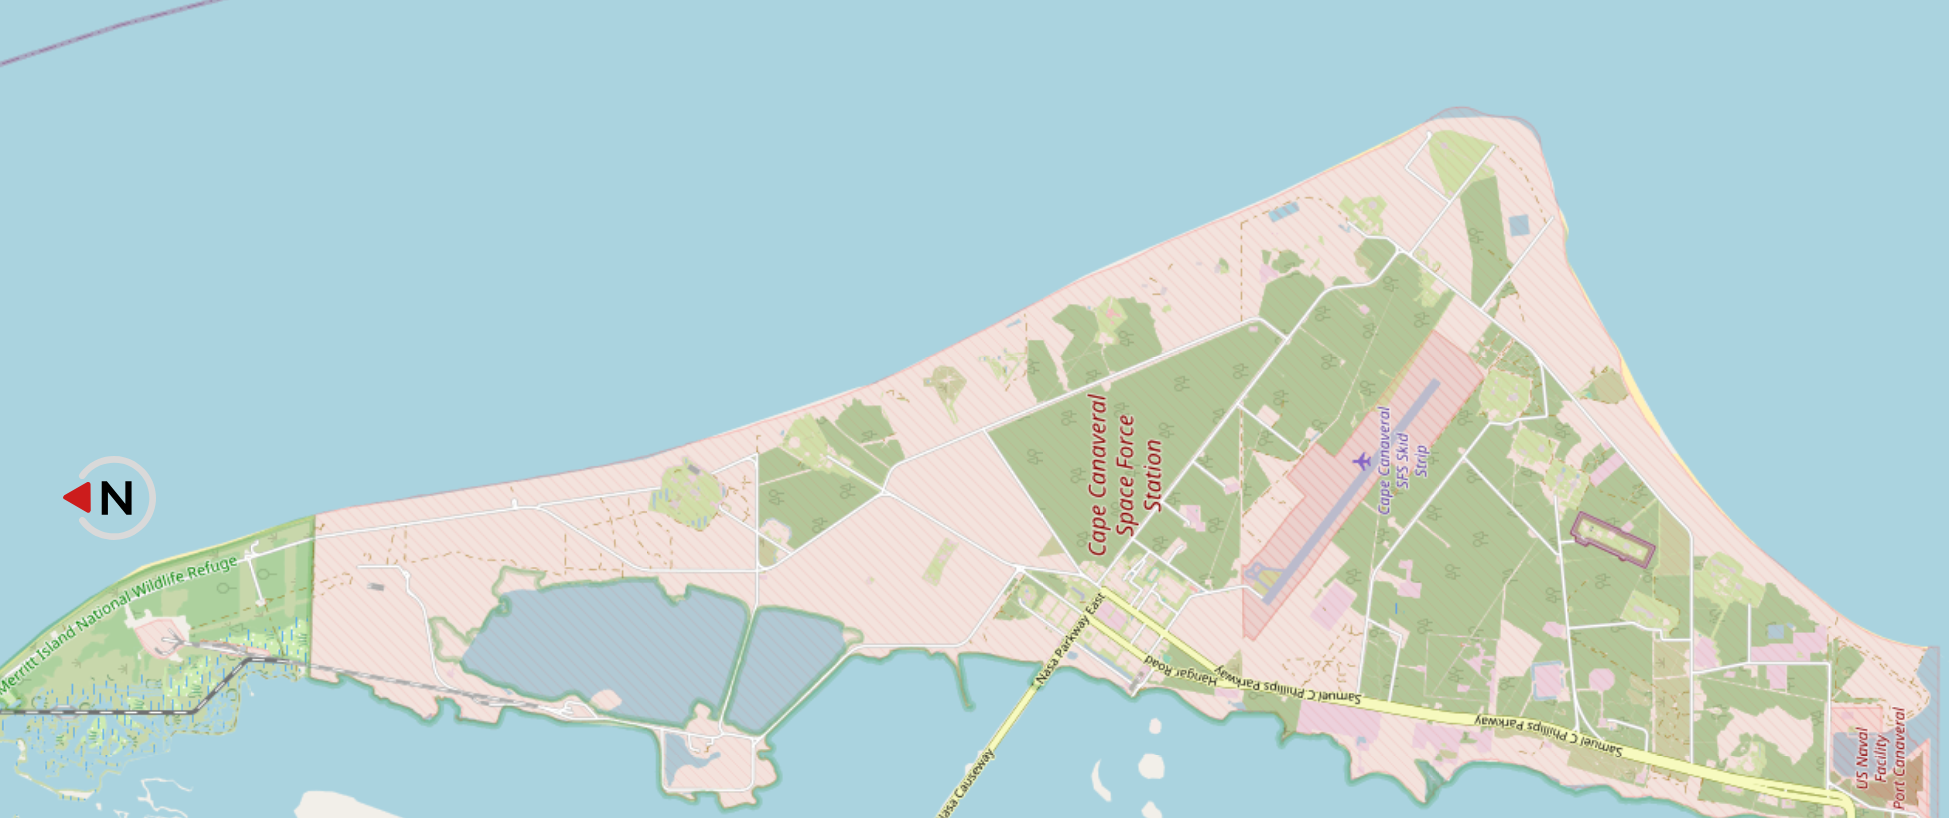
Click the Compass Rose to change the map to the vertical (North up) orientation

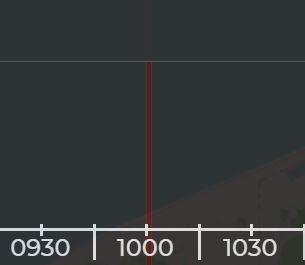
A faint red Playhead on the Timeline points to the time currently visualized on the map.
Navigation
Scrub right on the Timeline to to view upcoming Events; scrub left to view past Events.

Click the Live button (in upper right corner) to return to the current date and time view
Click an Event Pill on the Timeline.

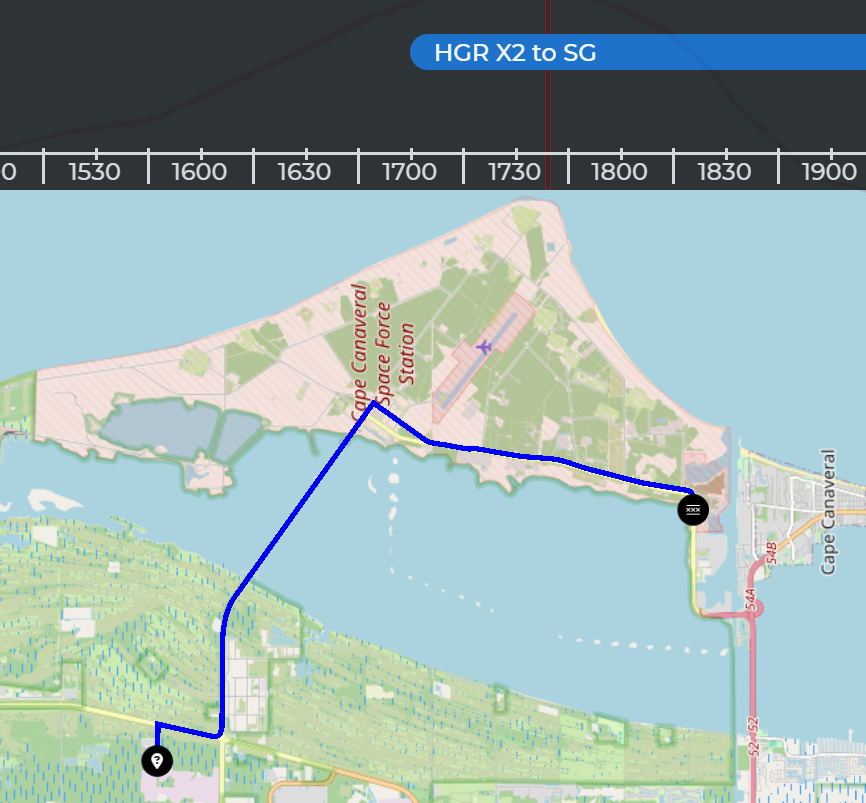
Once the Pill hits the Timeline (i.e., displays near the Playhead), your selected Event will be visualized on the map
Example: The image below shows a visualization of the starting point, planned route, and end point for the Transport Event HGR X2 to SG
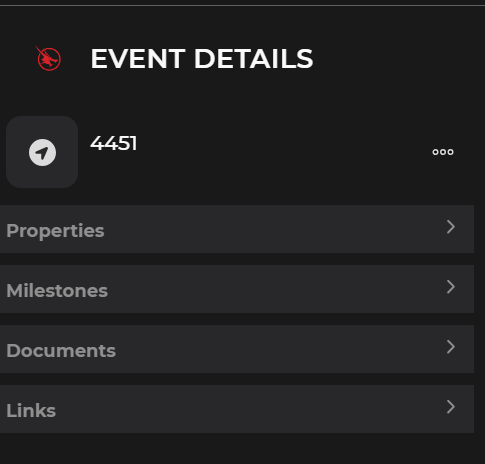
For further inspection, click the specific Event (on the Timeline or map) to open the Event Details pane in the left side panel.
Click the About (i) button at the bottom of the left-hand panel to:
View Beast Core version information
Request support for a question or problem


