The Analytics Dashboard lists high-level information about Faults and/or Systems, allows users to monitor System Faults and Statuses, and facilitates decision-making and quick resolution of issues.
Analytics Dashboard Layout
The Analytics Dashboard is composed of two panels that can be used to identify faults and drill into fault details.
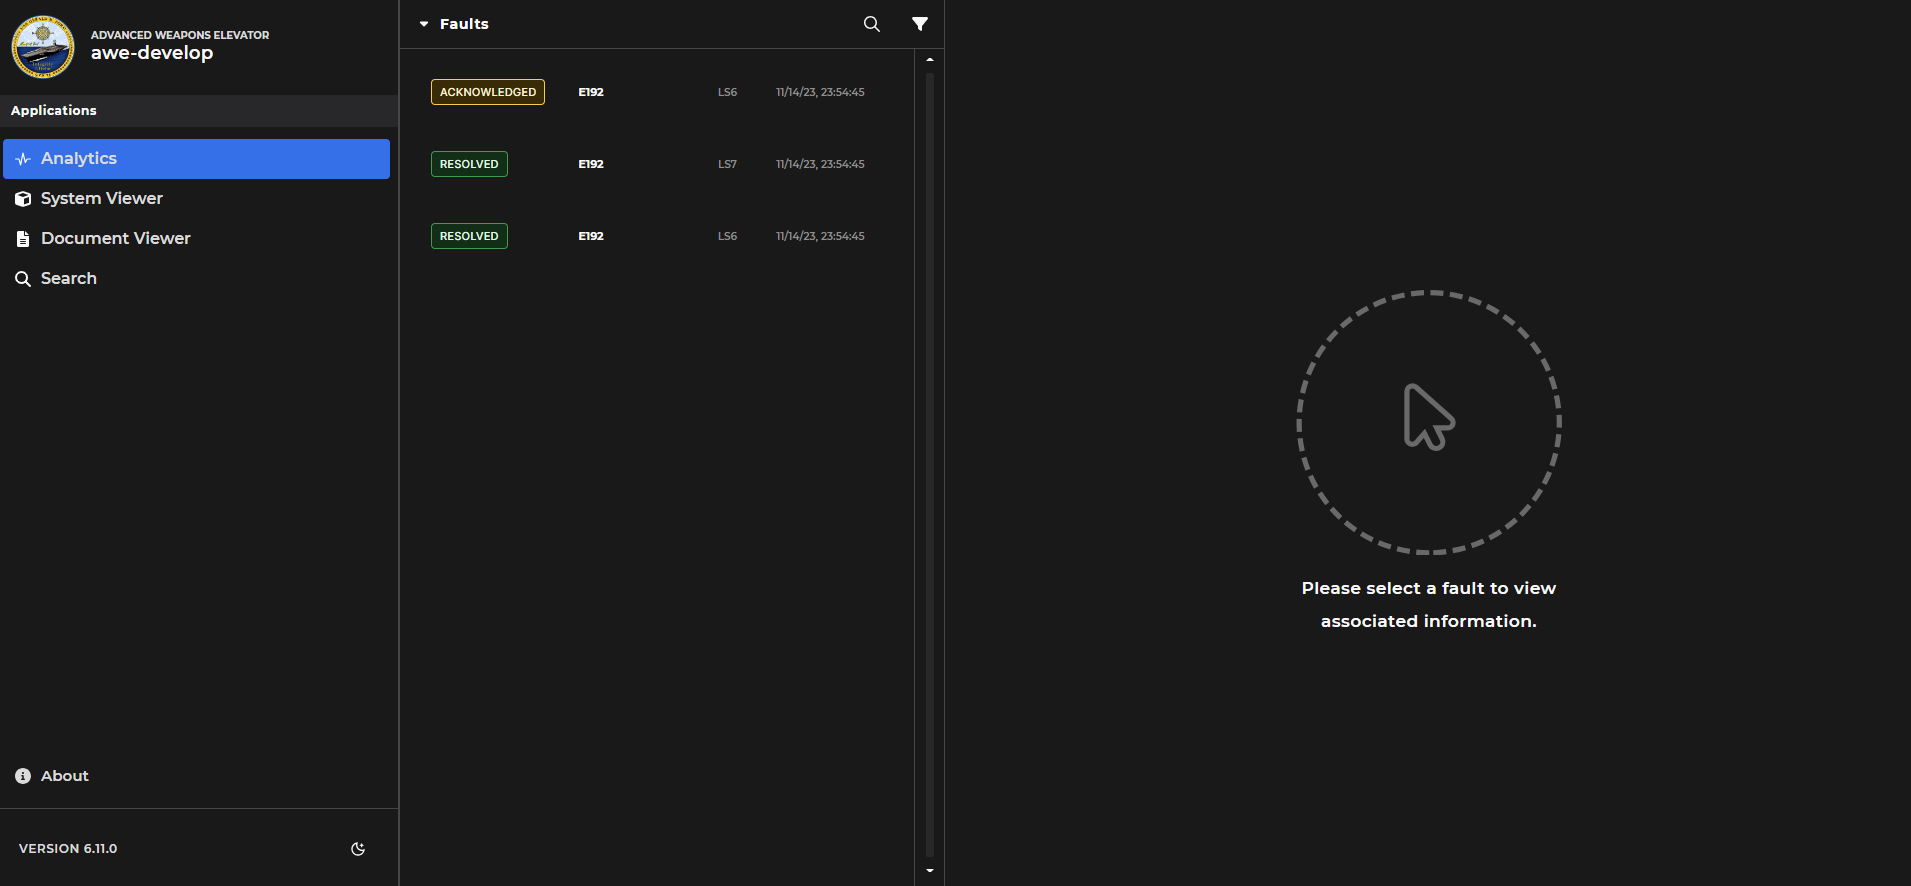
The left panel of the dashboard displays:
Faults dropdown menu
Search (magnifying glass icon)
Filter (funnel icon)
Main Dashboard window
Right-hand Scroll Bar (displays if content exceeds window size)

The right panel of the dashboard displays:
Header above the Content Viewer window
Name of selected Fault
Time stamp (i.e., date and time of Fault detection)
Affected System (only if the Content Viewer supplies a System list)

Default message - displays when no specific Fault is selected (highlighted) in the main Dashboard window

Functionality on Various Devices
The Analytics Dashboard is viewable on various devices, including:
Desktops
Tablets
Mobile phone screens
When using a desktop or tablet, the associated Content Viewer displays specific information relevant to your selected item on the right-hand side of your screen
When using a mobile device, you cannot view the Dashboard and the Content Viewer at the same time due to limited screen size
When you select a Fault on the Dashboard, the whole screen will load the Content Viewer
Select the provided back arrow on the Content Viewer screen to return to the Dashboard

NOTE
The Analytics Dashboard currently supports GraphQL.